Файл:Graphic data for World Record Progression in Men and Women Swimming 50m-100m-200m.png
Перейти до навігації
Перейти до пошуку

Розмір при попередньому перегляді: 800 × 526 пікселів. Інші роздільності: 320 × 210 пікселів | 640 × 421 пікселів | 1024 × 673 пікселів | 1280 × 842 пікселів | 2560 × 1683 пікселів | 3162 × 2079 пікселів.
Повна роздільність (3162 × 2079 пікселів, розмір файлу: 783 КБ, MIME-тип: image/png)
| Відомості про цей файл містяться на Вікісховищі — централізованому сховищі вільних файлів мультимедіа для використання у проектах Фонду Вікімедіа. |

|
Це зображення має бути конвертоване у векторний формат SVG. Це дає декілька переваг, докладніше про які Ви можете прочитати на сторінці Commons:Media for cleanup. Якщо Вам вже зараз доступна векторна версія даного зображення, завантажте її, будь ласка. Після завантаження замініть цей шаблон на такий: {{vector version available|Назва_завантаженого_файлу.svg}}.
|
Опис файлу
| Опис |
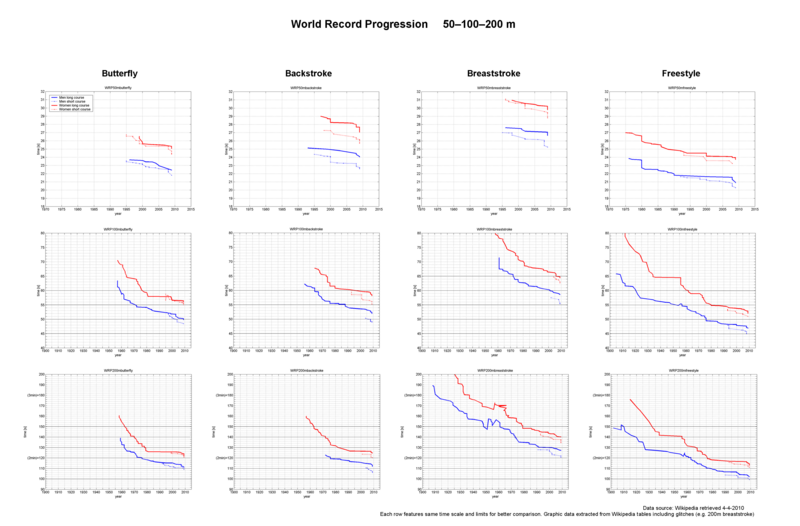
English: Graphic data for World Record Progression in Men and Women Swimming 50m-100m-200m Long and Short Course Butterfly-Backstroke-Breaststroke-Freestyle. Original table data retrieved from Wikipedia (including glitches e.g. as found in 200m breaststroke) on 2010-04-04
Except source data, this is original work by the author |
| Час створення | |
| Джерело | Власна робота |
| Автор | Krfx |
author typed own code in Matlab (R) (~Octave) to retrieve data from Wikipedia World Record Progression tables like http://en.wikipedia.org/wiki/World_record_progression_100_metres_freestyle
Use the code to produce further graphic data according to procedure written in code remarks
Code is free for anyone to copy, redistribute, modify, etc. without any links to the author
function [yr,ti]=pooldata(datafile)
% this is matlab code (~octave) i wrote myself for everyone to use and transform table data into graphics data
% according to the following procedure and context:
%
% reads data from datafile (.txt file) containing a formatted "ctrl+c" copy from wikipedia "record progression" table style
% as found e.g. in http://en.wikipedia.org/wiki/World_record_progression_100_metres_freestyle
% each line in datafile should be similar to this one:
% 1 	 53.46  		Almsick , Franziska van Franziska van Almsick 	 Germany 	01993-01-06 6 January 1993 	World Cup 	China, Shanghai ?  People's Republic of China Shanghai, China
% (the '%' sign at the beginning of the line is for matlab remark purposes, should not be on actual .txt file)
% copy the whole table (men long course, short, women long, short) and separate each subtable with a blank line
%
% if you simply do a ctrl+c copy from the table itself on the wiki page and ctrl+v into notepad, you should
% hit nearly this format. sometimes you may get a double line for a single entry: to make it a single line,
% just backspace once at the beginning of the second line

%lstyle is a string with color and linestyle data for the plot command (see matlab specs)

% sample call:
% pooldata('WRP100mbreaststroke.txt');

% feel free to modify, copy, redistribute this code without any reference to its author, provided you make
% some job in transforming wiki table data into graphic data


lstyle={'.-b','.:b','.-r','.:r'};

fid=fopen(datafile,'rt');
ee=1;
ct=1;
ctype=1;
while ee
   a=fgetl(fid);
   ischar(a)
   if ischar(a)
      if ~isempty(a)
	      %warning: the following takes out ':' from string data if time is equal or more than 1'
   	   %this is valid only for the specific format
      	tt=str2num(strrep(a(6:14),':',''));
      	%tt=str2num(strrep(a(1:7),':','')); % use this alternate formula depending on where the time "column" is found on the table
      	tt=floor(tt/100)*60+mod(tt,100);%works out actual seconds

      	ti(ct)=tt;%stores time for this entry
      	ii=findstr(a,'-');yr(ct)=str2num(a(ii(1)-4:ii(1)-1));%looks for a year data marker on the string and stores the year (see how this is coded on the .txt file)
	  	   %ii=findstr(a,',');yr(ct)=str2num(a(ii(1)+2:ii(1)+5));%alternate formula depending on how the data is coded (see how this is coded on the .txt file)
      	ct=ct+1;
   	else
         lll=a;
         plot(yr,ti,lstyle{ctype},'linewidth',2)
         hold on
         ctype=ctype+1;ct=1;
         clear yr ti
   	end
   else
      ee=0;
      plot(yr,ti,lstyle{ctype},'linewidth',2)
   end
end

fclose(fid);
grid on
hold on
axis([1900 2015 90 200])
set(gca,'ytick',[90:2:200])
set(gca,'xtick',[1900:5:2015])
set(gca,'YTickLabel',{'90','','','','','100','','','','','110','','','','','(2min)=120','','','','','130','','','','','140','','','','','150','','','','','160','','','','','170','','','','','(3min)=180','','','','','190','','','','','200'})
set(gca,'XTickLabel',{'1900','','1910','','1920','','1930','','1940','','1950','','1960','','1970','','1980','','1990','','2000','','2010',''})

%add these last lines when you're done
title(datafile(1:end-4))
ylabel('time [s]')
xlabel('year')
%legend('Men long course','Men short course','Women long course','Women short course') %legend depends on the data you put (of course)
Ліцензування
| Я, власник авторських прав на цю роботу, передаю роботу в суспільне надбання. Застосовується по всьому світу. У деяких країнах це не може бути юридично можливо, в такому випадку: Я даю кожному право на використання цієї роботи для будь-яких цілей, без будь-яких умов, якщо такі умови не вимагаються за законом. |
Історія файлу
Клацніть на дату/час, щоб переглянути, як тоді виглядав файл.
| Дата/час | Мініатюра | Розмір об'єкта | Користувач | Коментар | |
|---|---|---|---|---|---|
| поточний | 12:40, 4 квітня 2010 | | 3162 × 2079 (783 КБ) | Krfx | {{Information |Description={{en|1=Graphic data for World Record Progression in Men and Women Swimming 50m-100m-200m Long and Short Course Butterfly-Backstroke-Breaststroke-Freestyle. Original table data retrieved from Wikipedia (including glitches e.g. as |
Використання файлу
Такі сторінки використовують цей файл:
- Хронологія світових рекордів з плавання на дистанції 100 метрів батерфляєм
- Хронологія світових рекордів з плавання на дистанції 100 метрів брасом
- Хронологія світових рекордів з плавання на дистанції 100 метрів вільним стилем
- Хронологія світових рекордів з плавання на дистанції 100 метрів на спині
- Хронологія світових рекордів з плавання на дистанції 200 метрів батерфляєм
- Хронологія світових рекордів з плавання на дистанції 200 метрів брасом
- Хронологія світових рекордів з плавання на дистанції 200 метрів вільним стилем
- Хронологія світових рекордів з плавання на дистанції 200 метрів на спині
- Хронологія світових рекордів з плавання на дистанції 50 метрів батерфляєм
- Хронологія світових рекордів з плавання на дистанції 50 метрів брасом
- Хронологія світових рекордів з плавання на дистанції 50 метрів вільним стилем
- Хронологія світових рекордів з плавання на дистанції 50 метрів на спині
Глобальне використання файлу
Цей файл використовують такі інші вікі:
- Використання в en.wikipedia.org
- World record progression 50 metres freestyle
- World record progression 200 metres butterfly
- World record progression 100 metres butterfly
- World record progression 100 metres breaststroke
- World record progression 100 metres freestyle
- World record progression 200 metres freestyle
- World record progression 50 metres backstroke
- World record progression 100 metres backstroke
- World record progression 200 metres backstroke
- World record progression 50 metres butterfly
- World record progression 50 metres breaststroke
- World record progression 200 metres breaststroke
- History of swimming
- Використання в ko.wikipedia.org
- Використання в ru.wikipedia.org