Файл:Hash table average insertion time.png

Повна роздільність (954 × 620 пікселів, розмір файлу: 5 КБ, MIME-тип: image/png)
| Відомості про цей файл містяться на Вікісховищі — централізованому сховищі вільних файлів мультимедіа для використання у проектах Фонду Вікімедіа. |

|
Цей графік має бути конвертований у векторний формат SVG. Це дає декілька переваг, докладніше про які Ви можете прочитати на сторінці Commons:Media for cleanup. Якщо Вам вже зараз доступна векторна версія даного зображення, завантажте її, будь ласка. Після завантаження замініть цей шаблон на такий: {{vector version available|Назва_завантаженого_файлу.svg}}.
|
Опис файлу
| Опис |
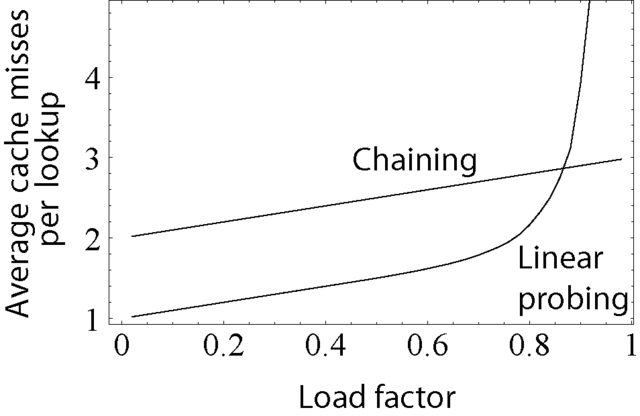
Shows the average number of cache misses expected when inserting into a hash table with various collision resolution mechanisms; on modern machines, this is a good estimate of actual clock time required. This seems to confirm the common heuristic that performance begins to degrade at about 80% table density. Created in Mathematica, Illustrator, and Photoshop. It is based on a simulated model of a hash table where the hash function chooses indexes for each insertion uniformly at random. The parameters of the model were:
For modern CPUs, which have many kilobytes of L1 cache, same logic applies for tables far bigger than size of the cache. You may be curious what happens in the case where no cache exists. In other words, how does the number of probes (number of reads, number of comparisons) rise as the table fills? The curve is similar in shape to the one above, but shifted left: it requires an average of 24 probes for an 80% full table, and you have to go down to a 50% full table for only 3 probes to be required on average. This suggests that in the absence of a cache, ideally your hash table should be about twice as large for probing as for chaining. |
||
| Джерело |
Author's Own Work. Це PNG графічне зображення було створено з допомогою Mathematica |
||
| Автор | Derrick Coetzee (User:Dcoetzee) | ||
| Ліцензія (Повторне використання цього файлу) |
|
Mathematica Coding
Because the linear probing values varied widely according to the random choices used to fill the table, I took the average value over 25 runs. The (rather inefficient) Mathematica code used to generate the table follows:
<<Statistics`DescriptiveStatistics`;

f[tablesize_,points_,cachewords_]:=
  Module[{i,r,j,compares1,compares2,k,slots1,slots2},
    slots1 = Table[0,{i,1,tablesize}];
    slots2 = Table[0,{i,1,tablesize}];
    Table[
      For[i=0,i<Floor[Length[slots1]/(points+1)],i++,
        r=Random[Integer,{1,Length[slots1]}];
        slots1[[r]]++];
      For[i=0,i<Length[slots1]/(points+1),i++,
        r=Random[Integer,{1,Length[slots2]}];
        For[j=r,slots2[[j]]>0,j=If[j\[Equal]Length[slots2],1,j+1]];
        slots2[[j]]++];
      compares2=0;
      For[i=1,i<=Length[slots2],i++,
        For[j=i,slots2[[j]]>0,j=If[j\[Equal]Length[slots2],1,j+1]];
        compares2+=
          Ceiling[If[j\[GreaterEqual]i,j-i,j+Length[slots2]-i]/cachewords]];
      {N[Apply[Plus,slots1]/Length[slots1]]+2,
        N[compares2/Length[slots2]]+1},{k,1,points}]];

t=Table[f[1000,49,16],{i,1,25}];
Export["Hash_table_average_insertion_time.eps",
  Show[Map[ListPlot[#,PlotJoined\[Rule]True,Frame\[Rule]True,
          FormatType\[Rule]TraditionalForm,
          FrameLabel\[Rule]{"Density of table",
              "Average cache misses per insertion"},Axes\[Rule]False]&,
      Table[{i/50,Mean[Table[t[[k,i,j]],{k,1,Length[t]}]]},{j,1,2},{i,1,
          Length[t[[1]]]}]]]]
Історія файлу
Клацніть на дату/час, щоб переглянути, як тоді виглядав файл.
| Дата/час | Мініатюра | Розмір об'єкта | Користувач | Коментар | |
|---|---|---|---|---|---|
| поточний | 23:52, 25 лютого 2011 | | 954 × 620 (5 КБ) | Perhelion | test PNGOUT plugin |
| 05:16, 9 листопада 2005 |  | 954 × 620 (12 КБ) | Dcoetzee | Upload bigger version, add 1 to chaining line (due to external storage), change labels | |
| 01:49, 8 листопада 2005 |  | 250 × 162 (6 КБ) | Dcoetzee | Shows the average number of cache misses expected when inserting into a hash table with various collision resolution mechanisms; on modern machines, this is a good estimate of actual clock time required. This seems to confirm the common heuristic that per |
Використання файлу
Така сторінка використовує цей файл:
Глобальне використання файлу
Цей файл використовують такі інші вікі:
- Використання в en.wikipedia.org
- Використання в en.wikibooks.org
- Використання в sk.wikipedia.org
- Використання в zh.wikipedia.org