Файл:CO2 responsibility 1950-2000.svg

Повна роздільність (SVG-файл, номінально 940 × 477 пікселів, розмір файлу: 1,98 МБ)
| Відомості про цей файл містяться на Вікісховищі — централізованому сховищі вільних файлів мультимедіа для використання у проектах Фонду Вікімедіа. |
Опис файлу
| Опис |
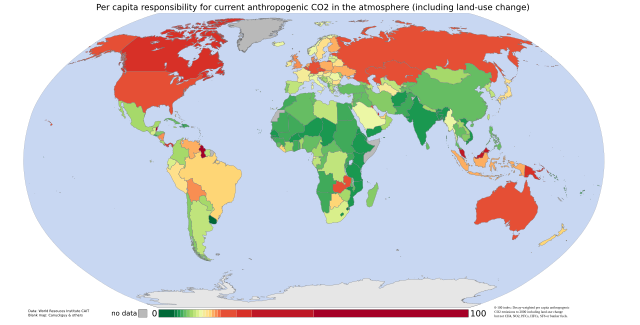
English: Cumulative per capita responsibility for anthropogenic CO2
Data from the World Resources Institute's CAIT 4.0 database (registration required). Includes CO2 emitted up to the year 2000 only (not CH4, N20, PFCs, HFCs or SF6). Estimates of the effects of land-use change are included; bunker-fuel emissions are not. The scale is a 0-100 decay-weighted index. The land-use estimates include the following (list from the relevant CAIT data note):
those of the original ecosystem
of forests in many tropical regions)
estimates include the emissions of carbon from wood products (burned, stored in longterm pools, decayed over time)
Also from the CAIT data note: "It is also important to note that the calculated flux of carbon does not explicitly include changes in carbon stocks that may result from various forms of management. Examples of what is not included are agricultural intensification, fertilization, the trend to no-till agriculture, thinning of forests, changes in species or varieties, and other silvicultural practices." And the data note warns that "these estimates of national sources and sinks of carbon from land-use change are uncertain on the order of +/- 150% for large fluxes, and +/- 50 MtC/yr for estimates near zero." So CAIT's land-use estimates are a bit wild. They are, however, the best currently available at a national level. |
| Час створення | 05/9/07 |
| Джерело | self-made using data from the World Resources Institute and a blank map by Canuckguy and others |
| Автор | Vinny Burgoo |
Ліцензування

|
Дозволяється копіювати, розповсюджувати та/або модифікувати цей документ на умовах ліцензії GNU FDL версії 1.2 або більш пізньої, виданої Фондом вільного програмного забезпечення, без незмінних розділів, без текстів, які розміщені на першій та останній обкладинці. Копія ліцензії знаходиться у розділі GNU Free Documentation License. |
| Цей файл ліцензований на умовах ліцензії Creative Commons Attribution-Share Alike 3.0 Unported | ||
| ||
| Цей шаблон ліцензування був доданий до файлу в рамках оновлення ліцензії GFDL. |
Історія файлу
Клацніть на дату/час, щоб переглянути, як тоді виглядав файл.
| Дата/час | Мініатюра | Розмір об'єкта | Користувач | Коментар | |
|---|---|---|---|---|---|
| поточний | 23:22, 4 вересня 2007 | | 940 × 477 (1,98 МБ) | Vinny Burgoo | {{Information |Description='''Cumulative per capita responsibility for anthropogenic CO2''' Data from the World Resources Institute's [http://cait.wri.org/ CAIT 4.0 database] (registration required). Includes CO2 only (not CH4, N20, PFCs, HFCs or SF6). E |
Використання файлу
Така сторінка використовує цей файл:
Глобальне використання файлу
Цей файл використовують такі інші вікі:
- Використання в ar.wikipedia.org
- Використання в bn.wikipedia.org
- Використання в bs.wikipedia.org
- Використання в ca.wikipedia.org
- Використання в cs.wikipedia.org
- Використання в da.wikipedia.org
- Використання в de.wikipedia.org
- Використання в en.wikipedia.org
- Використання в et.wikipedia.org
- Використання в eu.wikipedia.org
- Використання в fa.wikipedia.org
- Використання в fr.wikipedia.org
- Використання в gu.wikipedia.org
- Використання в ha.wikipedia.org
- Використання в he.wikipedia.org
- Використання в hi.wikipedia.org
- Використання в hy.wikipedia.org
- Використання в mk.wikipedia.org
- Використання в pnb.wikipedia.org
- Використання в pt.wikipedia.org
- Використання в ru.wikipedia.org
- Використання в so.wikipedia.org
- Використання в ta.wikipedia.org
- Використання в th.wikipedia.org
- Використання в ur.wikipedia.org
- Використання в vi.wikipedia.org
- Використання в zh.wikipedia.org