Файл:Butterworth response.png
Повна роздільність (1240 × 880 пікселів, розмір файлу: 86 КБ, MIME-тип: image/png)
| Відомості про цей файл містяться на Вікісховищі — централізованому сховищі вільних файлів мультимедіа для використання у проектах Фонду Вікімедіа. |
Опис файлу
| Опис |
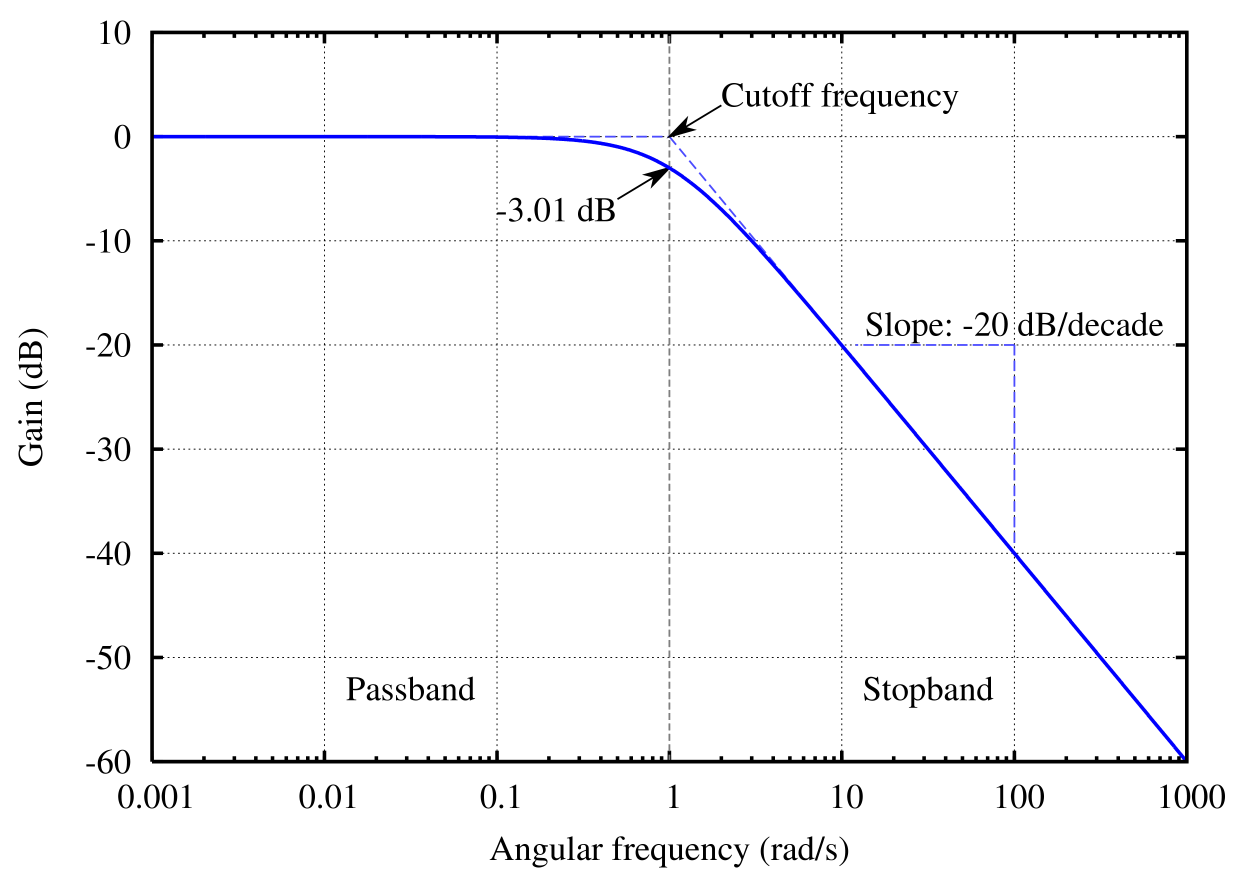
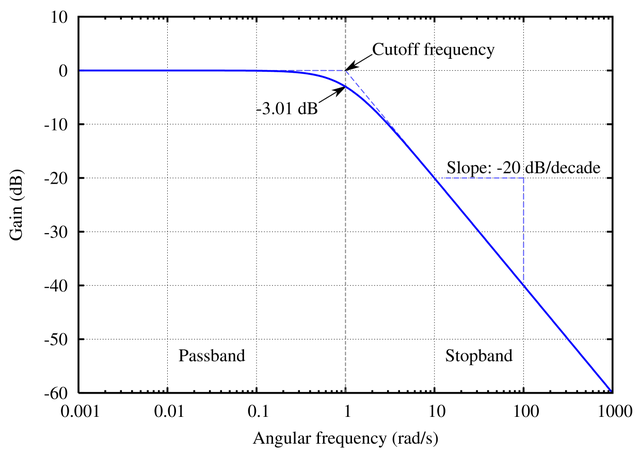
English: The frequency response of a Butterworth filter with logarithmic axes (Bode plot) and various labels. Cutoff frequency is normalized to 1 rad/s. Gain is normalized to 0 dB in the passband.
Many orders on one plot: File:Butterworth orders.png. Version with no text available at File:Butterworth plain.png, though you should probably just modify the source code and regenerate it in your own language. See Wikipedia graph-making tips. Це PNG графічне зображення було створено з допомогою Gnuplot. Generated in gnuplot with the script below (save as butterworth.plt and then open in gnuplot). Then I opened the butterworth.ps file in a text editor to edit the line colors and linestyles, as per this description. This avoids needing to open in proprietary software, and really isn't that difficult (especially if you don't know the commands in the proprietary software either). ;-) Identify the lines easily by their color (the arrow is currently magenta and I want it to be black. Ah, there is the entry with 1 0 1, red + blue = magenta) or by using the gnuplot linestyle−1. (For instance, gnuplot's linestyle 3 corresponds to the ps file's /LT2.) Then you can edit the colors and dashes by hand. I changed the original: /LT0 { PL [] 1 0 0 DL } def
/LT1 { PL [4 dl 2 dl] 0 1 0 DL } def
/LT2 { PL [2 dl 3 dl] 0 0 1 DL } def
/LT3 { PL [1 dl 1.5 dl] 1 0 1 DL } def
into this: /LT0 { PL [] 0 0 1 DL } def
/LT1 { PL [4 dl 2 dl] 0.5 0.5 0.5 DL } def
/LT2 { PL [6 dl 3 dl] 0.3 0.3 1 DL } def
/LT3 { PL [] 0 0 0 DL } def
/LT4–/LT8 I left unchanged. (I don't know what they're used for anyway.) /LTw, /LTb, and /LTa are for the grid lines and such.To convert the PostScript file to PNG:
|
| Час створення | 26 червня 2005 (дата завантаження) |
| Джерело | Власна робота |
| Автор | Omegatron |
| Інші версії |
|
| gnuplot source | click to expand
set samples 2001
set terminal postscript enhanced landscape color lw 2 "Times-Roman" 20
set output "butterworth.ps"

# Butterworth amplitude response and decibel calculation.  n is the order, which is just 1 in this image.
G(w,n) = 1 / (sqrt(1 + w**(2*n)))
dB(x) = 20 * log10(abs(x))

# Gridlines
set grid

# Set x axis to logarithmic scale
set logscale x 10

# Set range of x and y axes
set xrange [0.001:1000]
set yrange [-60:10]

# Create x-axis tic marks once per decade (every multiple of 10)
set xtics 10

# Use 10 x-axis minor divisions per major division
set mxtics 10

# Axis labels
set xlabel "Angular frequency (rad/s)"
set ylabel "Gain (dB)"

# No need for a key
set nokey #0.1,-25

# Frequency response's line plotting style
set style line 1 lt 1 lw 2

# Draw a separator between passband and stopband and label them
set style line 2 lt 2 lw 1
set style arrow 2 nohead ls 2
set arrow 3 from 1,-60 to 1,10 as 2

# Label coordinates are relative to the graph window, not to the function, centered at the 1/4 and 3/4 width points
set label 1 "Passband" at graph 0.25, graph 0.1 c
set label 2 "Stopband" at graph 0.75, graph 0.1 c

# Asymptote lines and slope lines are the same "arrow" style
set style line 3 lt 3 lw 1
set style arrow 3 nohead ls 3

# Draw asymptote lines
set arrow 1 from 1,0 to 1000,-60 as 3
set arrow 2 from .001,0 to 1,0 as 3

# -3 dB arrow style and arrow
set style line 4 lt 4 lw 1
set style arrow 4 head filled size screen 0.02,15,45 ls 4
set arrow 4 from 2,3 to 1,0 as 4

# "Cutoff frequency" label uses same coordinates as the function
set label 3 "Cutoff frequency" at 2,4 l

# "-3 dB" label
set arrow 5 from 0.5,-6 to 1,-3 as 4
set label 4 "-3.01 dB" at 0.5,-7 r

# Draw slope lines and label
set arrow 6 from 100,-20 to 12,-20 as 3
set arrow 7 from 100,-20 to 100,-39 as 3
set label 5 "Slope: -20 dB/decade" at 100,-18 c

# Plot the filter response
plot \
     dB(G(x,1)) ls 1  title "1st-order response"
|


|
Є векторний варіант цього зображення (SVG).
Його слід використовувати замість цієї растрової версії для більш якісного відображення. File:Butterworth response.png → File:Butterworth response.svg
Щоб дізнатися більше про векторну графіку, прочитайте статтю «Перетворення зображень у формат SVG». Також доступна інформація про підтримку формату SVG у MediaWiki. |
 |
Ліцензування
- Ви можете вільно:
- ділитися – копіювати, поширювати і передавати твір
- модифікувати – переробляти твір
- При дотриманні таких умов:
- зазначення авторства – Ви повинні вказати авторство, надати посилання на ліцензію і вказати, чи якісь зміни було внесено до оригінального твору. Ви можете зробити це в будь-який розсудливий спосіб, але так, щоб він жодним чином не натякав на те, наче ліцензіар підтримує Вас чи Ваш спосіб використання твору.
- поширення на тих же умовах – Якщо ви змінюєте, перетворюєте або створюєте іншу похідну роботу на основі цього твору, ви можете поширювати отриманий у результаті твір тільки на умовах такої ж або сумісної ліцензії.

|
Дозволяється копіювати, розповсюджувати та/або модифікувати цей документ на умовах ліцензії GNU FDL версії 1.2 або більш пізньої, виданої Фондом вільного програмного забезпечення, без незмінних розділів, без текстів, які розміщені на першій та останній обкладинці. Копія ліцензії знаходиться у розділі GNU Free Documentation License. |
Історія файлу
Клацніть на дату/час, щоб переглянути, як тоді виглядав файл.
| Дата/час | Мініатюра | Розмір об'єкта | Користувач | Коментар | |
|---|---|---|---|---|---|
| поточний | 17:45, 23 липня 2005 | | 1240 × 880 (86 КБ) | Omegatron | split the cutoff frequency markers |
| 16:31, 23 липня 2005 |  | 1250 × 880 (92 КБ) | Omegatron | Better butterworth filter response curve | |
| 19:54, 26 червня 2005 |  | 250 × 220 (2 КБ) | Omegatron | A graph or diagram made by User:Omegatron. (Uploaded with Wikimedia Commons.) Source: Created by User:Omegatron {{GFDL}}{{cc-by-sa-2.0}} Category:Diagrams\ |
Використання файлу
Нема сторінок, що використовують цей файл.
Глобальне використання файлу
Цей файл використовують такі інші вікі:
- Використання в be-tarask.wikipedia.org
- Використання в de.wikipedia.org
- Використання в eo.wikipedia.org
- Використання в et.wikipedia.org
- Використання в fr.wikipedia.org
- Використання в hi.wikipedia.org
- Використання в it.wikipedia.org
- Використання в ja.wikipedia.org
- Використання в pl.wikipedia.org
- Використання в pt.wikipedia.org
- Використання в zh.wikipedia.org