Файл:StationaryStatesAnimation.gif

Матеріал з Вікіпедії — вільної енциклопедії.
Перейти до навігації Перейти до пошуку

StationaryStatesAnimation.gif(300 × 280 пікселів, розмір файлу: 223 КБ, MIME-тип: image/gif, кільцеве, 41 кадр)

Wikimedia Commons logo Відомості про цей файл містяться на Вікісховищі — централізованому сховищі вільних файлів мультимедіа для використання у проектах Фонду Вікімедіа.

Опис файлу

Опис
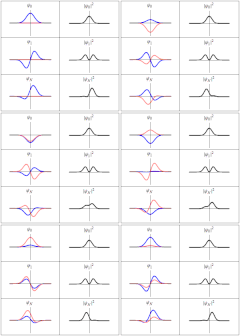
English: Three wavefunction solutions to the Time-Dependent Schrödinger equation for a harmonic oscillator. Left: The real part (blue) and imaginary part (red) of the wavefunction. Right: The probability of finding the particle at a certain position. The top two rows are the lowest two energy eigenstates, and the bottom is the superposition state , which is not an energy eigenstate. The right column illustrates why energy eigenstates are also called "stationary states".
Thus in every quantum stae,there are certain preferred positions of maximum probability
Час створення
Джерело Власна робота
Автор Sbyrnes321
(* Source code written in Mathematica 6.0 by Steve Byrnes, Feb. 2011. This source code is public domain. *)
(* Shows classical and quantum trajectory animations for a harmonic potential. Assume m=w=hbar=1. *)
ClearAll["Global`*"]
(*** Wavefunctions of the energy eigenstates ***)
psi[n_, x_] := (2^n*n!)^(-1/2)*Pi^(-1/4)*Exp[-x^2/2]*HermiteH[n, x];
energy[n_] := n + 1/2;
psit[n_, x_, t_] := psi[n, x] Exp[-I*energy[n]*t];
(*** A non-stationary state ***)
SeedRandom[1];
psinonstationary[x_, t_] := (psit[0, x, t]+psit[1, x, t])/Sqrt[2];

(*** Put all the plots together ***)
SetOptions[Plot, {PlotRange -> {-1, 1}, Ticks -> None, PlotStyle -> {Directive[Thick, Blue], Directive[Thick, Pink]}}];
MakeFrame[t_] := GraphicsGrid[
   {{Plot[{Re[psit[0, x, t]], Im[psit[0, x, t]]}, {x, -5, 5}, PlotLabel -> Subscript[\[Psi],0]], 
     Plot[Abs[psit[0, x, t]]^2, {x, -5, 5}, PlotStyle -> Directive[Thick, Black],
		PlotLabel -> TraditionalForm[Abs[Subscript[\[Psi],0]]^2]]},
   {Plot[{Re[psit[1, x, t]], Im[psit[1, x, t]]}, {x, -5, 5}, PlotLabel -> Subscript[\[Psi],1]], 
     Plot[Abs[psit[1, x, t]]^2, {x, -5, 5}, PlotStyle -> Directive[Thick, Black],
		PlotLabel -> TraditionalForm[Abs[Subscript[\[Psi],1]]^2]]},
   {Plot[{Re[psinonstationary[x, t]], Im[psinonstationary[x, t]]}, {x, -5, 5}, PlotLabel -> Subscript[\[Psi],N]], 
     Plot[Abs[psinonstationary[x, t]]^2, {x, -5, 5}, PlotStyle -> Directive[Thick, Black],
		PlotLabel -> TraditionalForm[Abs[Subscript[\[Psi],N]]^2]]}
   }, Frame -> All, ImageSize -> 300];
output = Table[MakeFrame[t], {t, 0, 4 Pi*40/41, 4 Pi/41}];
SetDirectory["C:\\Users\\Steve\\Desktop"]
Export["test.gif", output]

Ліцензування

Я, власник авторських прав на цей твір, добровільно публікую його на умовах такої ліцензії:
Creative Commons CC-Zero Цей файл доступний на умовах Creative Commons CC0 1.0 Universal Public Domain Dedication.
Особа, що пов'язала роботу з даною дією, передала роботу у суспільне надбання шляхом відмови від усіх своїх прав на роботу по всьому світу по закону про авторське право, включаючи всі пов'язані і суміжні права, в тій мірі, що допускається законом.

Ви можете копіювати, змінювати, розповсюджувати і виконувати роботу, навіть на комерційній основі, не питаючи дозволу.

Підписи

Додайте однорядкове пояснення, що саме репрезентує цей файл

Об'єкти, показані на цьому файлі

зображує

Історія файлу

Клацніть на дату/час, щоб переглянути, як тоді виглядав файл.

Дата/часМініатюраРозмір об'єктаКористувачКоментар
поточний18:21, 20 березня 2011Мініатюра для версії від 18:21, 20 березня 2011300 × 280 (223 КБ)Sbyrnes321{{Information |Description ={{en|1=Three wavefunction solutions to the Time-Dependent Schrödinger equation for a harmonic oscillator. Left: The real part (blue) and imaginary part (red) of the wavefunction. Right: The probability of finding the partic

Така сторінка використовує цей файл:

Глобальне використання файлу

Цей файл використовують такі інші вікі: