Файл:Phanerozoic Climate Change.png

Phanerozoic_Climate_Change.png (726 × 520 пікселів, розмір файлу: 30 КБ, MIME-тип: image/png)
| Відомості про цей файл містяться на Вікісховищі — централізованому сховищі вільних файлів мультимедіа для використання у проектах Фонду Вікімедіа. |
Опис файлу
| Опис |
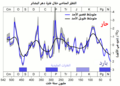
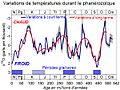
English:  This figure shows the long-term evolution of oxygen isotope ratios during the Phanerozoic eon as measured in fossils, reported by Veizer et al. (1999), and updated online in 2004.[1] Such ratios reflect both the local temperature at the site of deposition and global changes associated with the extent of permanent continental glaciation. As such, relative changes in oxygen isotope ratios can be interpreted as rough changes in climate. Quantitative conversion between these data and direct temperature changes is a complicated process subject to many systematic uncertainties, however it is estimated that each 1 part per thousand change in δ18O represents roughly a 1.5-2 °C change in tropical sea surface temperatures (Veizer et al. 2000). Also shown on this figure are blue bars showing periods when geological criteria (Frakes et al. 1992) indicate cold temperatures and glaciation as reported by Veizer et al. (2000). The Jurassic-Cretaceous period, plotted as a lighter blue bar, was interpreted as a "cool" period on geological grounds, but the configuration of continents at that time appears to have prevented the formation of large scale ice sheets. All data presented here have been adjusted to 2004 ICS geologic timescale.[2] The "short-term average" was constructed by applying a σ = 3 Myr Gaussian weighted moving average to the original 16,692 reported measurements. The gray bar is the associated 95% statistical uncertainty in the moving average. The "long-term average" is a σ = 15 Myr Gaussian average of the short-term record (see notes). On geologic time scales, the largest shift in oxygen isotope ratios is due to the slow radiogenic evolution of the mantle. A variety of proposals exist for dealing with this, and are subject to a variety of systematic biases, but the most common approach is simply to suppress long-term trends in the record. This approach was applied in this case by subtracting a quadratic polynomial fit to the short-term averages. As a result, it is not possible to draw any conclusion about very long-term (>200 Myr) changes in temperatures from this data alone. However, it is usually believed that temperatures during the present cold period and during the Cretaceous thermal maximum are not greatly different from cold and hot periods during most of the rest the Phanerozoic. However, recently this has been disputed by Royer et al. (2004), who suggest that the highs and lows in the early part of the Phanerozoic were both significantly warmer than their recent counterparts. Common symbols for geologic periods are plotted at the top and bottom of the figure for reference.
The long-term changes in isotope ratios have been interpreted as a ~140 Myr quasi-periodicity in global climate (Veizer et al. 2000) and some authors (Shaviv and Veizer 2003) have interpreted this periodicity as being driven by the solar system's motions about the galaxy. Encounters with galactic spiral arms can plausibly lead to a factor of 3 increase in cosmic ray flux. Since cosmic rays are the primary source of ionization in the troposphere, these events can plausibly impact global climate. A major limitation of this theory is that existing measurements can only poorly constrain the timing of encounters with the spiral arms. The more traditional view is that long-term changes in global climate are controlled by geologic forces, and in particular, changes in the configuration of continents as a result of plate tectonics. |
|||
| Час створення | 12 June 2005 | |||
| Джерело | Власна робота | |||
| Автор | Dragons flight | |||
| Ліцензія (Повторне використання цього файлу) |
This figure was originally prepared by Dragons flight from publicly available data and is part of the Global Warming Art project. | |||
| Інші версії |
|


Ліцензування

|
Дозволяється копіювати, розповсюджувати та/або модифікувати цей документ на умовах ліцензії GNU FDL версії 1.2 або більш пізньої, виданої Фондом вільного програмного забезпечення, без незмінних розділів, без текстів, які розміщені на першій та останній обкладинці. Копія ліцензії знаходиться у розділі GNU Free Documentation License. |
| Цей файл ліцензований на умовах Creative Commons Attribution-Share Alike 3.0 Unported | ||
| ||
| Цей шаблон ліцензування був доданий до файлу в рамках оновлення ліцензії GFDL. |
References
- Frakes, L. A., Francis, J. E. & Syktus, J. I. (1992) Climate Modes of the Phanerozoic (Cambridge Univ. Press, Cambridge).
- Royer, Dana L., Robert A. Berner, Isabel P. Montañez, Neil J. Tabor, and David J. Beerling (2004). GSA Today 14 (3): 4-10. doi:10.1130/1052-5173(2004)014<4:CAAPDO>2.0.CO;2
- Shaviv, N. and Veizer, J. (2003) Celestial driver of Phanerozoic climate? GSA Today July 2003, 4-10.
- Veizer, J., Ala, D., Azmy, K., Bruckschen, P., Buhl, D., Bruhn, F., Carden, G.A.F., Diener, A., Ebneth, S., Godderis, Y., Jasper, T., Korte, C., Pawellek, F., Podlaha, O. and Strauss, H. (1999) 87Sr/86Sr, d13C and d18O evolution of Phanerozoic seawater. Chemical Geology 161, 59-88.
- Veizer, J., Godderis, Y. and Francois, L.M. (2000) Evidence for decoupling of atmospheric CO2 and global climate during the Phanerozoic eon. Nature 408, 698-701.
Notes
- The statistical errors, plotted in gray, may be significantly smaller than the systematic biases that can occur. Such systematic concerns include:
- Different fossil types, spanning different phyla, are measured in different parts of the record, and biological differences in how oxygen is incorporated into different fossils may introduce biases.
- Because oxygen isotopes reflect both local temperatures and global glaciation, it is necessary to sample from large spatial areas to provide adequate global coverage. Such extensive coverage may not be available in all time periods (particularly older periods).
- In constructing the "long-term average", the filter was applied to the short-term averages rather than to the data directly because applying such a filter to the data directly strongly biases the results towards the value at times that have been heavily sampled.
| Dragons flight's Temperature Record Series |
| This figure is part of a series of plots created by Dragons flight to illustrate changes in Earth's temperature and climate across many different time scales. |
| Time Period: 25 yrs | 150 yrs | 1 kyr | 2 kyr | 12 kyr | 450 kyr | 5 Myr | 65 Myr | 500 Myr |
| For articles related to this topic see: Temperature record |
Derivative works
Похідні роботи від цього файлу: Geologic time scale Climate Change.png
-
 Arabic
 -
 French
 -
 Portuguese (SVG)
 -
 Spanish


Історія файлу
Клацніть на дату/час, щоб переглянути, як тоді виглядав файл.
| Дата/час | Мініатюра | Розмір об'єкта | Користувач | Коментар | |
|---|---|---|---|---|---|
| поточний | 12:57, 18 липня 2010 | | 726 × 520 (30 КБ) | SeL media | reversed time axis |
| 08:30, 12 червня 2005 |  | 726 × 520 (36 КБ) | Samulili |
Використання файлу
Такі сторінки використовують цей файл:
- Інтерстадіал
- Агассіз (озеро)
- Аллередська осциляція
- Антарктичний льодовиковий щит
- Антарктичний холодний реверс
- Атлантичний період
- Балтійське льодовикове озеро
- Беллінгська осциляція
- Бореальний період
- Восток (озеро)
- Вюрм
- Вісконсинське зледеніння
- Глобальне потепління
- Глобальне похолодання 6200 року до н. е.
- Гренландський льодовиковий щит
- Гуронське зледеніння
- Дегляціація
- Дніпровське зледеніння
- Західноантарктичний льодовиковий щит
- Земля-сніжка
- Зледеніння
- Кліматичний песимум раннього Середньовіччя
- Лаврентійський льодовиковий щит
- Льодовикова річка Воррен
- Льодовикове озеро
- Малий льодовиковий період
- Меєндорфська осциляція
- Найдавніший дріас
- Неолітичний субплювіал
- Нижній перон
- Оксиген-18
- Останній льодовиковий максимум
- Останній льодовиковий період
- Осциляція Дансгора — Ешгера
- Патагонський льодовиковий щит
- Події Бонда
- Посуха 2200 року до н. е.
- Посуха 3900 року до н. е.
- Похолодання 535—536 років
- Похолодання залізної доби
- Похолодання середньобронзової доби
- Пребореальний період
- Протерозойське зледеніння
- Південнопатагонське льодовикове поле
- Північнопатагонське льодовикове поле
- Підльодовикове озеро
- Пізній дріас
- Піорська осциляція
- Римський кліматичний оптимум
- Рісський гляціал
- Середньовічний кліматичний оптимум
- Стурегга
- Субатлантичний період
- Суббореальний період
- Східноантарктичний льодовиковий щит
- Четвертинне зледеніння
- Шаблон:Заледеніння
Глобальне використання файлу
Цей файл використовують такі інші вікі:
- Використання в af.wikipedia.org
- Використання в ar.wikipedia.org
- Використання в ast.wikipedia.org
- Використання в az.wikipedia.org
- Використання в bg.wikipedia.org
- Використання в bs.wikipedia.org
- Використання в ca.wikipedia.org
- Використання в cs.wikipedia.org
- Використання в da.wikipedia.org
- Використання в de.wikipedia.org
- Використання в en.wikipedia.org
- Oxygen
- Paleoclimatology
- Timeline of glaciation
- Geologic temperature record
- User:Dragons flight/Images
- Oxygen isotope ratio cycle
- Quaternary glaciation
- Ventastega
- User:AlexD/.appliedgeography
- Talk:Climate change/Archive 24
- User:Mporter/Climate data
- User:Debnigo
- User talk:Epipelagic/Archive 2009
- Cretaceous Thermal Maximum
- Talk:Climate variability and change/Archive 4
- User:Mark Buchanan/sandbox/QuatGlac
- Використання в en.wikibooks.org
- Використання в es.wikipedia.org
- Використання в et.wikipedia.org
- Використання в fa.wikipedia.org
- Використання в fi.wikipedia.org
- Використання в fr.wikipedia.org
- Використання в fy.wikipedia.org
- Використання в gl.wikipedia.org
- Використання в hr.wikipedia.org
- Використання в hu.wikipedia.org
Переглянути сторінку глобального використання цього файлу.